RSE Stories: An Interview With Lydia Lucchesi and Sam Nelson

Posted by Paula Martinez on 08 August 2022
This post was originally published as a news item on the Australian Research Data Commons website (1 August, 2022). Lydia Lucchesi (ANU) and Sam Nelson (Data61) won the inaugural Venables Award, established by the Statistical Society of Australia in partnership with the ARDC to recognise new developers of open source software for data analytics.
As part of our Research Software Agenda for Australia, the ARDC is working with the research community to shape better research software in order to recognise it as a first-class output of research.
This interview is part of a series about research software engineers. Each month we talk with a research software engineer about their experiences and best-practice tips in creating, improving and sustaining software for research.
Continuing the series, we talked with the winners of the Venables Award, which was established by the Statistical Society of Australia in partnership with the ARDC. This award recognises the valuable contributions made to research when new ideas, methods and models are captured as research software.
Meet the winners of the inaugural Venables Award, Lydia Lucchesi, a PhD candidate at the Australian National University and an affiliate with CSIRO’s Data61, and teammate Sam Nelson, a Research Technician in the Biosecurity Risk team, CSIRO’s Data61, who worked together with Dr Petra Kuhnert, a data scientist at CSIRO Data61, on the research software project Vizumap.
Diverse pathways into research software engineering
Sam: I’m a Research Technician in the Biosecurity Risk team in Data61. I have a bachelor’s degree in computer science majoring in software development, and I originally joined CSIRO as a cadet through the Indigenous Cadetship program in 2017, and have been working full-time since. My work predominantly revolves around visualising data, in the form of web applications.
A lot of the work I do is web development based on building up different websites for different tools. A lot of the time I’m working alongside statisticians to get their data into something that’s interactive and that people can access and use, even if they don’t have knowledge of how to program.
One interesting project I worked on recently was creating a visual tool to support the release of a sterile mosquito in Saudi Arabia. The sterile mosquito reduces the overall population of mosquitoes, and hence reduces the spread of mosquito-borne diseases.
Lydia: Currently, I’m interested in data preprocessing and how we can better communicate data preprocessing decisions. We’ve been developing a new visualisation, the Smallset Timeline, to capture and present preprocessing decisions in a simple static figure. We have also been working on an accompanying software tool, smallsets. The goal is to create a practical tool that data scientists can use in their day-to-day work. We recently published a paper about Smallset Timelines.
In general, I enjoy that my everyday work is a mix of brainstorming visualisation ideas and coding to bring them to life. I like working on visualisation tools that equip us to communicate information often overlooked in research dissemination, such as uncertainty of spatial estimates or data preprocessing decisions.
What is Vizumap?
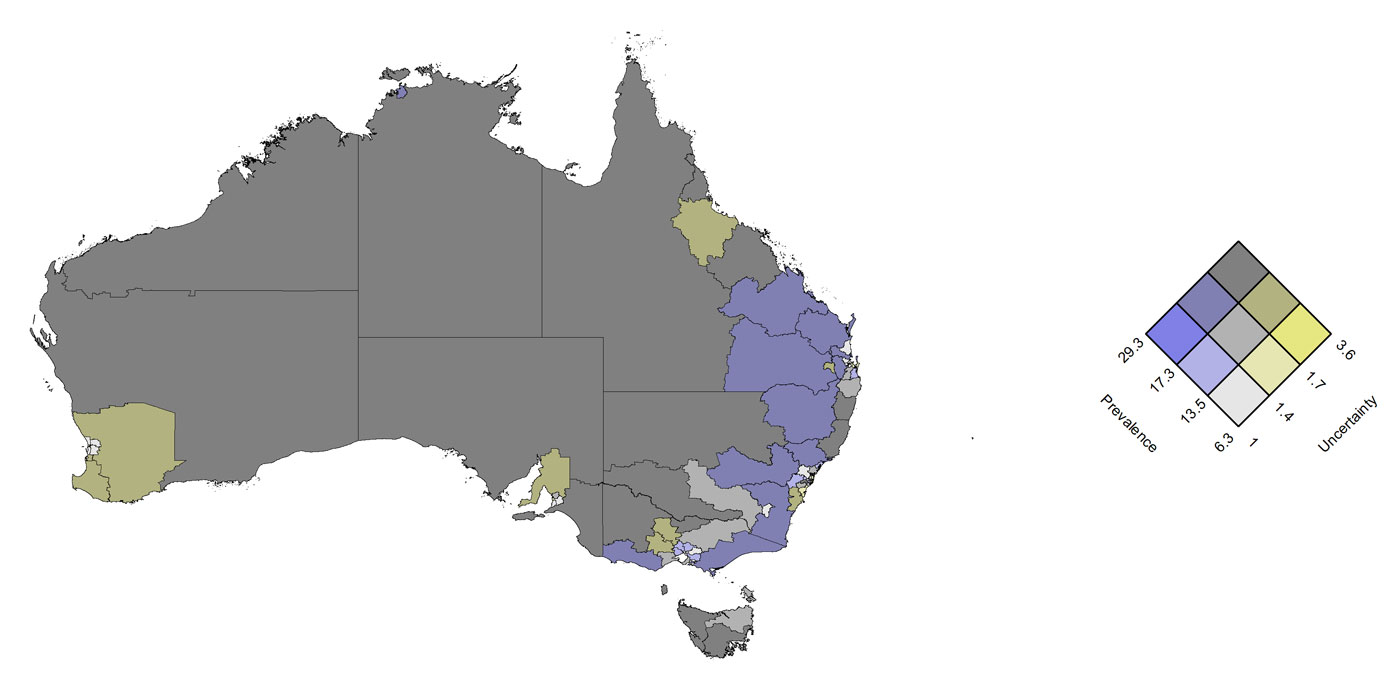
Vizumap is a tool for visualising uncertainty in spatial data. While graphs can have error bars to visualise uncertainty in the data, it’s much more difficult to show uncertainty on maps. Vizumap offers four different ways to visualise uncertainty on a map itself, helping statisticians, scientists, data journalists and others show uncertainty within a map. This demonstrates the quality and strength of the evidence and aids data-driven decision making.
Vizumap has been used across diverse research fields, from social science to environmental science to epidemiology. Examples of maps that have been created using Vizumap includes:
- Prevalence estimates of undernutrition in children in Bangladesh
- Estimates of locust abundance in Australia
- Estimated pollutant loads of sediment flowing into the Great Barrier Reef
- Poverty estimates from the American Community Survey.
This software project has two components: the R package and the interactive visualisation app. The Vizumap R package in continual development is publicly available on GitHub and documented in the Journal of Open Source Software. The interactive visualisation app is called VizumApp, and its source code is available on GitHub.
Where did the idea for Vizumap originate?
Lydia: The project started at the University of Missouri, where I was studying statistics and working as a research assistant for Professor Chris Wikle. He researches spatio-temporal statistics and posed an interesting visualisation problem: how can we show both areal data estimates and uncertainty on a single map?
Chris and I would discuss map ideas, and I would create example maps using R. Chris introduced me to his colleague in Australia, Petra at CSIRO’s Data61, who suggested we take the existing code and turn it into a generalised R package that would allow others to create the uncertainty maps for their own spatial data.
Petra brought me over to Australia for a month, and we worked together to write an R package. Since then, Sam and Petra have worked hard to make creating these maps more accessible and engaging through an interactive Shiny app, VizumApp. It even overlays the maps on satellite imagery.
What was the most exciting part about developing Vizumap?
To create Vizumap, Lydia worked on the R package with Petra, while Sam developed the interactive visualisation app, VizumApp.
Sam: The most exciting part about developing the interactive visualisation app VizumApp was being able to bring something like this to the broader community, not just those who can use R.
Lydia: Travelling from the United States to Australia to spend a month at CSIRO’s Data61 to work with and learn from Petra. It was a great experience. Now it’s exciting to see the different applications of the maps in real-world research projects.
What’s next for Vizumap and VizumApp?
Sam: We have a running list of ideas about how we would like to improve and enhance VizumApp. For example, we’d like users to be able to export the code behind the map for further customisation or inclusion in an RMarkdown document. We also think it would be neat if one could compare several map snapshots within the app.
Lydia: It’s important to maintain software, but it’s also hard as you move in new directions to stay diligent about maintaining code for a project that was started a while ago. Although I’m not quite sure what will happen next with Vizumap, I would like to make sure it continues to run smoothly so that people can use it. In general, I am looking forward to seeing what happens next with the VizumApp Shiny app and contributing to that where I can.
New ARDC-Sponsored Awards Now Open for Submissions
We’re excited to announce 2 new ARDC-sponsored awards for research software developers, currently open for submissions:
1. Ecological Society of Australia
The new ARDC Award for New Developers of Open Source Software in Ecology encourages new open source software development from the Australian ecological research community. It aims to support efforts to develop and share methodology, models and data in ecology and management of Australia’s ecological communities. Apply now >
2. Australian Bioinformatics and Computational Biology Society
The Torsten Seemann Outstanding Bioinformatics Software Developer Award, Sponsored by the ARDC, recognises an outstanding EMCR bioinformatic software developer from the Australian community. The Outstanding Bioinformatics Software Maintainer Award, also sponsored by the ARDC, recognises bioinformaticians who provide outstanding support and maintenance for widely used bioinformatics software. Apply now >
Stay tuned for our next interview in the Shaping Research Software series, coming out in September.
If you’d like to be part of the growing community of research software engineers in Australia, become a member of the RSE Association of Australia and New Zealand (RSE-AUNZ) (it’s free!).
Learn more about the ARDC’s Research Software Agenda for Australia.
Sam and Lydia were interviewed by Dr Paula Andrea Martinez and Jo Savill, ARDC. Reviewed by Dr Tom Honeyman (ARDC).
The ARDC is funded through the National Collaborative Research Infrastructure Strategy (NCRIS) to support national digital research infrastructure for Australian researchers.
